Bitcoin Illiquid Supply Hits Record 14.3M BTC as Big Investors Accumulate
- On-chain data providers estimate Bitcoin’s illiquid supply at a new high near 14.3 million BTC.
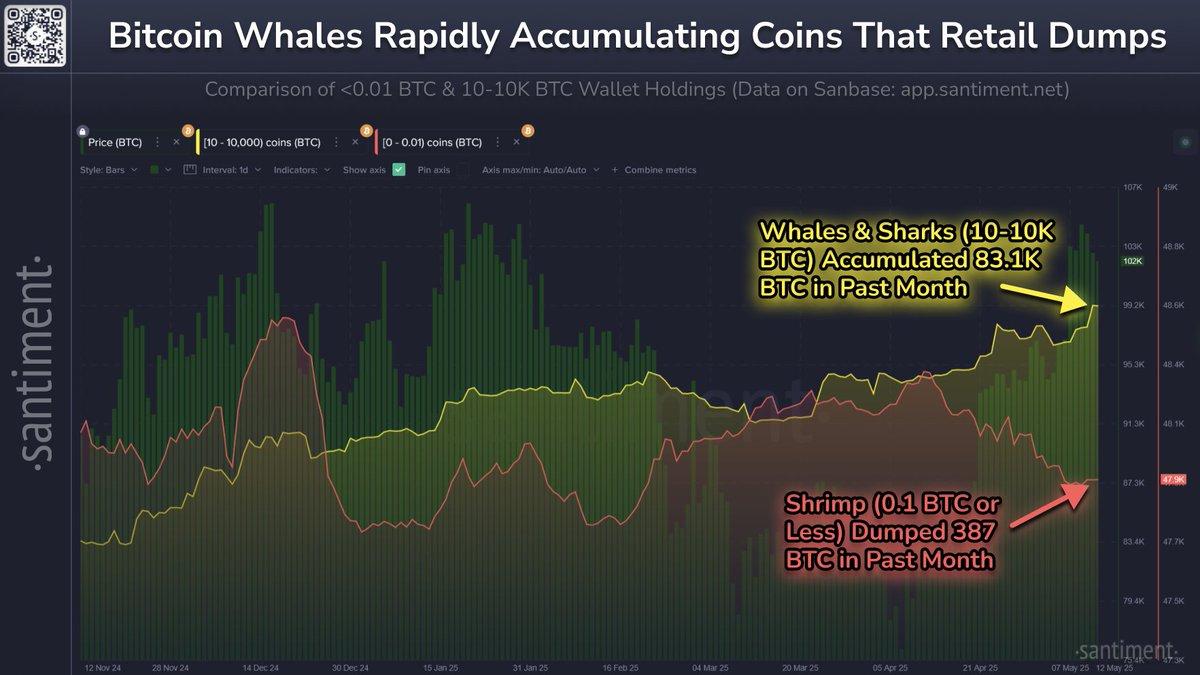
- Rising illiquidity suggests stronger conviction from long-term holders (LTHs), whales, and institutions.
- Exchange balances remain near multi‑year lows, amplifying the risk of supply squeezes during demand spikes.
- Spot Bitcoin ETF inflows and post‑halving miner dynamics contribute to structural supply tightness.
- While illiquidity has preceded strong cycles historically, short‑term price moves can still be volatile.
Introduction
Bitcoin’s market structure is quietly tightening. Recent on-chain analytics indicate that the illiquid supply of Bitcoin has climbed to a record ~14.3 million BTC, reflecting coins held in wallets with a low historical tendency to sell. That’s a meaningful data point in a market where circulating supply is finite, mining issuance is shrinking, and institutional demand is growing. In practical terms, more coins are in “strong hands,” reducing the pool of BTC readily available on exchanges and making price more sensitive to bursts of new demand.
This article breaks down what illiquid supply means, why it’s rising, how whales and institutions are influencing the trend, and what it could imply for Bitcoin’s price outlook, liquidity conditions, and risk management in 2025. You’ll also find practical tips for using on-chain metrics in your own research.
What Is “Illiquid Supply” – And Why It Matters
Illiquid supply refers to the share of Bitcoin held by entities with historically low selling behavior. On-chain analytics firms categorize addresses (or address clusters) based on spending patterns:
- Illiquid: Very low spending; coins are largely dormant or held with high conviction.
- Liquid: Moderate spending behavior; more likely to move coins.
- Highly Liquid: Frequent spending; coins often end up on exchanges.
The higher the illiquid share, the less supply is available to satisfy incremental demand. In previous cycles, rising illiquid supply often preceded periods of strong price performance as any demand shock (from retail, institutions, or macro catalysts) encountered a thinner active float.
Why Bitcoin’s Illiquid Supply Is Hitting Records
Several structural and cyclical forces are pushing more BTC into illiquid hands:
- Long-Term Holder (LTH) conviction: Addresses holding coins for extended periods (often >155 days) typically show lower propensity to sell. As LTH supply grows, illiquidity rises.
- Whale accumulation: Wallets controlling large balances (e.g., ≥1,000 BTC) tend to operate on multi‑year theses. Their net accumulation reduces tradable supply.
- Spot Bitcoin ETFs: Since their launch in 2024, U.S. spot ETFs have absorbed substantial BTC, effectively locking coins in custody structures that rarely churn.
- Exchange balance downtrend: Coins are moving off exchanges into cold storage and custodians, trimming the immediate sell-side supply.
- Post‑halving issuance: The 2024 halving reduced new BTC issuance, shrinking miner sell pressure. With fewer new coins entering the market, existing supply dynamics matter more.
Data Snapshot: Illiquid Supply in Context
The exact figure can vary by data provider due to differing methodologies, but the message is consistent: Bitcoin’s illiquid supply is at or near all‑time highs, recently estimated around 14.3M BTC. That’s a notable share of the circulating supply, intensifying the potential for liquidity gaps during demand surges.
| Milestone | Approx. Illiquid Supply | Backdrop |
|---|---|---|
| Pre‑2020 | ~10-11M BTC | Early LTH base forms; exchange dominance |
| 2021 Bull Phase | ~12-13M BTC | Institutional interest emerges; exchange outflows |
| 2024 Post‑ETF Launch | ~13.5-14M BTC | Spot ETF absorption; halving anticipation |
| 2025 Recent High | ~14.3M BTC | Whale & LTH accumulation; exchange balances low |
Note: Values are approximate and depend on provider definitions (e.g., address vs. entity adjustments, spending thresholds).
Who’s Accumulating? Whales, LTHs, and Institutions
Whales and Long‑Term Holders remain the backbone of illiquidity. In 2024-2025, two additional cohorts have magnified the effect:
- Spot ETF issuers and custodians: ETF demand channels investor capital into BTC held in structured custody, with low turnover compared to retail trading.
- Corporate treasuries and funds: Some companies and macro funds continue to treat Bitcoin as a reserve asset or long‑duration hedge, adding to illiquidity when they buy and hold.
| Cohort | Behavior | Impact on Liquidity |
|---|---|---|
| Whales (≥1,000 BTC) | Accumulate on drawdowns; sell into euphoria | Reduces float in mid-cycle; adds supply later |
| Long‑Term Holders (LTH) | Low spending; cost basis discipline | Raises illiquid share; stabilizes supply |
| Spot ETFs | Net inflows over months/quarters | Custodial lock‑up; consistent demand |
| Miners | Sell to cover costs; variable treasuries | Issuance slower post‑halving |
Exchange Balances: The Other Side of Illiquidity
Illiquid supply trends are often mirrored by declining exchange balances. When BTC flows off exchanges, immediate sell‑side liquidity shrinks. Today, multiple on‑chain dashboards show exchange-held BTC near multi-year lows. The implications include:
- Thin order books during spikes: Rapid price moves can occur when buyers compete over fewer coins.
- Greater sensitivity to macro news: CPI prints, rate decisions, or ETF flow surprises can cause outsized swings.
- Wider spreads and slippage: Particularly in smaller venues or off-peak hours.
Macro and Policy Backdrop
Macro conditions still matter, even in a supply‑tight market:
- Rates and liquidity: Shifts in real yields and global liquidity cycles influence risk appetite for Bitcoin.
- Regulatory clarity: The 2024 launch of U.S. spot ETFs marked progress; further global clarity can unlock new pools of capital.
- FX and sovereign dynamics: Currency weakness in certain regions has historically correlated with local BTC demand.
Does Rising Illiquid Supply Predict Higher Prices?
Historically, big upticks in illiquid supply have preceded or accompanied strong market phases. However, it’s not a timing tool. Consider:
- It signals structural tightness, not immediate rallies.
- Distribution phases still occur: Whales and LTHs may sell into strong uptrends, easing the squeeze.
- Exogenous shocks (macro, regulatory, exchange incidents) can override on‑chain trends in the short run.
In short, illiquidity sets the stage for potential supply squeezes when demand accelerates, but market timing requires a broader confluence of signals.
How to Use Illiquid Supply in Your Research
- Track the trend, not just the level: Rising illiquid supply over weeks and months is more informative than a single data point.
- Combine with exchange balances: If both illiquid supply and exchange outflows rise, the active float is shrinking.
- Cross‑check with demand proxies: ETF flows, stablecoin market caps, and funding rates can confirm demand-side pressure.
- Watch LTH/whale distribution: Distribution into strength often marks later‑stage rallies.
- Incorporate macro: Real yields, DXY, and liquidity indicators contextualize crypto risk-taking.
Practical Tips (Not Financial Advice)
- Position sizing: Treat Bitcoin as a high‑volatility asset. Size positions for multi‑sigma moves even in structurally tight markets.
- Use DCA with guardrails: If following a dollar‑cost averaging plan, consider pausing during euphoric spikes and resuming after pullbacks.
- Set liquidity-aware stops: Thin books can gap; use alerts and wider stop buffers in fast markets to reduce whipsaws.
- Diversify execution venues: Split orders across reputable exchanges or use algos (TWAP/VWAP) to minimize slippage.
- Cold storage best practices: If you self‑custody, use hardware wallets, multisig (if appropriate), and periodic recovery drills.
Mini Case Study: Illiquidity and Prior Cycles
2020-2021: As coins moved off exchanges and LTH supply climbed, Bitcoin experienced a powerful rally fueled by corporate treasury buys and retail momentum. Illiquidity amplified the move as fresh demand chased a smaller active float.
2024-2025: Spot ETF adoption created a new, persistent buyer base. Combined with post‑halving issuance cuts and continued whale accumulation, illiquid supply pushed to new highs. While markets still faced macro‑driven volatility, the structural backdrop turned increasingly supply‑constrained.
Risks and Counterpoints
- Concentration risk: Heavy whale or ETF custody concentration can increase systemic sensitivity if a large holder distributes quickly.
- Measurement nuances: Different on-chain providers segment wallets differently; illiquid classifications are estimates, not absolutes.
- Liquidity mirage: Off‑exchange OTC flows and internalized order flow can obscure true market depth.
- Macro reversals: Tightening financial conditions or risk‑off episodes can depress demand even as supply remains tight.
SEO-Friendly FAQs
What is Bitcoin’s illiquid supply?
It’s the portion of BTC held by entities with a low history of spending. These coins are less likely to hit the market, reducing the effective supply available to buyers.
Why is a record 14.3M BTC illiquid significant?
It reflects heightened accumulation by long-term holders, whales, and institutions (including ETFs), increasing the chance of supply squeezes when demand rises.
Does higher illiquidity guarantee price increases?
No. It’s a constructive structural signal, but short-term price depends on demand, macro conditions, and investor behavior.
How do ETFs influence illiquid supply?
Spot ETFs accumulate and custody BTC with low turnover, effectively removing coins from the active trading float for extended periods.
What other metrics should I monitor?
Exchange balances, LTH/whale net positions, ETF flows, stablecoin liquidity, funding rates, and macro indicators like real yields and dollar strength.
Actionable Checklist for Investors
- Follow reputable on-chain dashboards for illiquid supply and exchange balances.
- Track ETF net flows and custody growth as a demand proxy.
- Overlay macro calendars (CPI, FOMC) to anticipate volatility windows.
- Use execution algos or limit orders to navigate thinner liquidity.
- Reassess risk budgets during parabolic phases; illiquidity can cut both ways on reversals.
Conclusion
The climb of Bitcoin’s illiquid supply to an estimated 14.3 million BTC is a powerful signal that long-term holders, whales, and institutions are keeping a tighter grip on their coins. Combined with post‑halving issuance and persistent ETF demand, this dynamic reduces the active float and can magnify price responses to new buying pressure. Still, illiquidity is not a crystal ball – it’s one piece of a broader mosaic that includes macro conditions, demand flows, and investor psychology.
For traders and allocators, the takeaway is clear: monitor illiquid supply in tandem with exchange balances and demand indicators. Lean into disciplined risk management, optimize execution for thinner markets, and keep a steady eye on macro catalysts. In a structurally tight environment, preparation and process are your edge.
Related Keywords
Bitcoin illiquid supply, BTC accumulation, Bitcoin whales, long-term holders, on-chain analytics, Bitcoin ETFs, exchange balances, supply shock, Bitcoin price outlook, post‑halving dynamics, crypto liquidity, institutional adoption.


